Introducing ChartGG: The Next Generation Data Visualization Tool
ChartGG is a modern, powerful data visualization tool designed to make chart creation accessible and beautiful. Whether you're a data scientist, business analyst, or developer, ChartGG provides the tools you need to transform your data into compelling visual stories.
Key Features
1. Intuitive Chart Creation
With ChartGG's user-friendly interface, creating charts is as simple as selecting your data and choosing your preferred visualization style. Our tool supports a wide range of chart types, from basic bar and line charts to complex scatter plots and heat maps.
2. Customization Options
Every aspect of your charts can be customized to match your needs:
- Color schemes and palettes
- Font styles and sizes
- Axis labels and titles
- Legend positioning
- Interactive tooltips
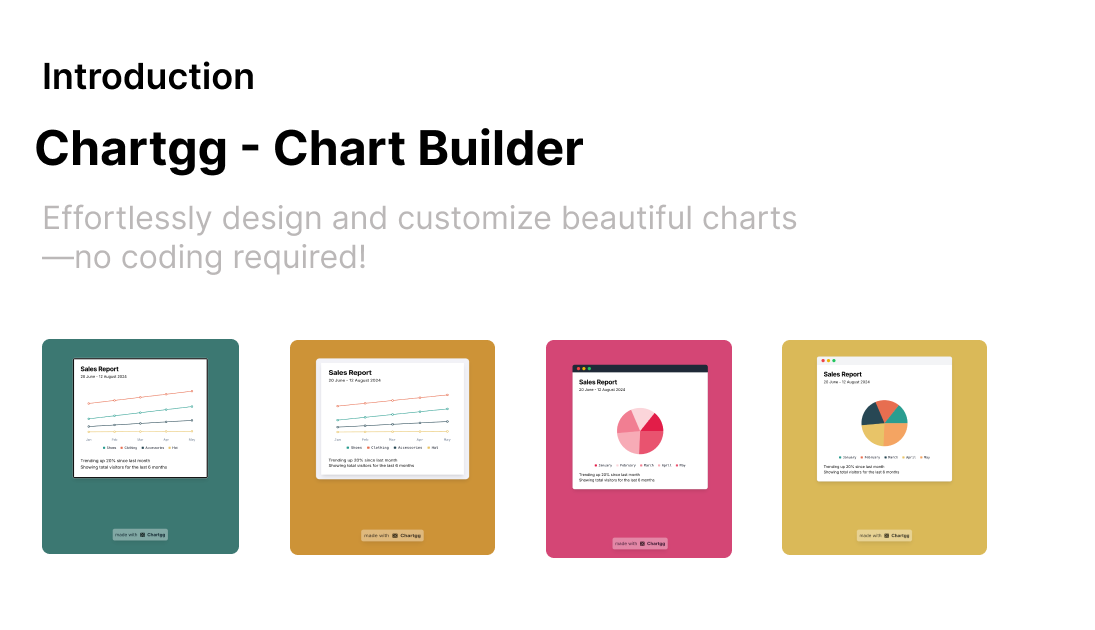
3. Styled Charts
Create beautiful, professionally styled charts with our curated themes and design system. Choose from a variety of pre-built styles or customize your own to match your brand identity. Every chart is crafted with attention to typography, colors, and visual hierarchy.
4. Export and Integration
Export your charts in various formats (PNG, SVG, PDF) or embed them directly into your applications. ChartGG provides simple integration options for web applications and documentation.
Getting Started
- Go to Editor
- Upload your data or connect to your data source
- Choose your chart type
- Customize your visualization
- Share or export your chart
Why Choose ChartGG?
- User-Friendly: No coding required - create professional charts through our intuitive interface
- Powerful: Advanced features for data professionals who need more control
- Fast: Generate charts quickly with optimized performance
- Modern: Built with the latest web technologies for a smooth experience
- Responsive: Your charts look great on any device
Start Creating Beautiful Charts Today
Join the growing community of data professionals who trust ChartGG for their visualization needs. Sign up now and transform your data into compelling visual stories.
Ready to Transform Your Data?
Start creating beautiful, interactive charts in minutes. No coding required.
Related Articles
The Evolution of Data Visualization: Trends to Watch in 2025
Explore the latest trends shaping the future of data visualization in 2025, from interactive experiences to AI-driven insights and ethical considerations.
The Importance of Chart Legends
Explore why chart legends are crucial in data visualization, enhancing clarity, consistency, and accessibility.
Mastering Chart Styling: Essential Principles for Effective Data Visualization
Learn the key principles of styling charts to create clear, impactful, and professional data visualizations that effectively communicate your insights.