
The Complete Guide to Line Charts
February 24, 2025
Master the art of creating effective line charts for data visualization
Expert tutorials, best practices, and the latest trends in chart design

Learn how to effectively use area charts for compelling data visualization
February 24, 2025
February 24, 2025
Master the art of creating effective line charts for data visualization

February 24, 2025
Learn how to effectively use pie charts to visualize part-to-whole relationships in your data
February 24, 2025
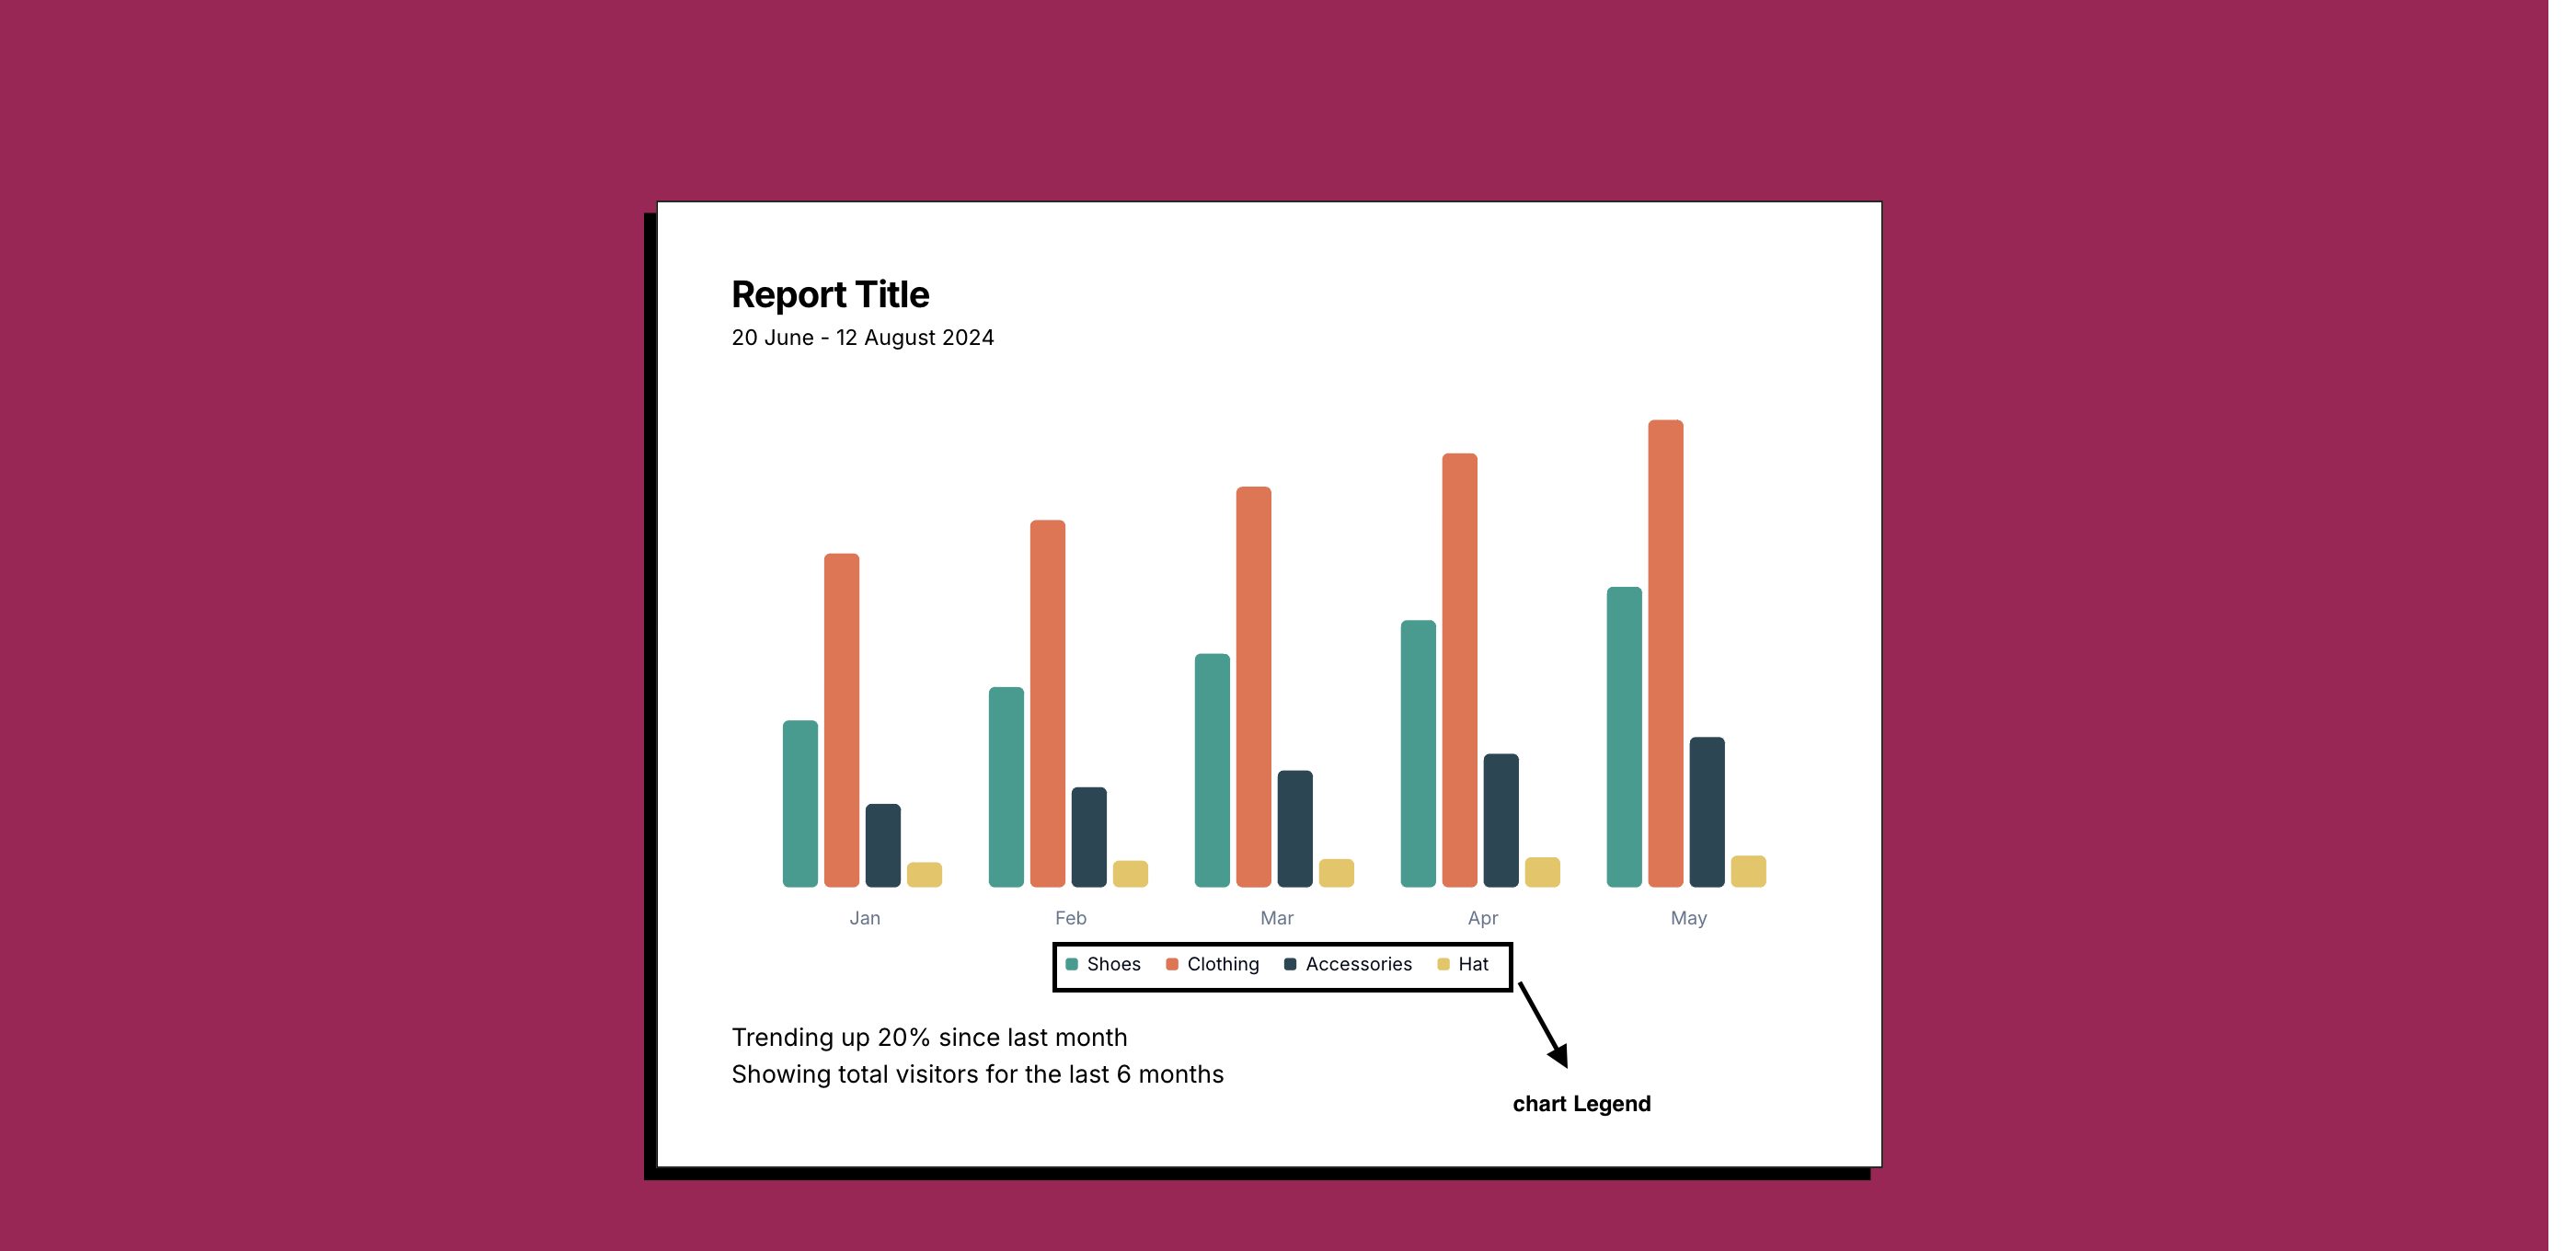
Learn everything about chart legends - from basic concepts to advanced implementation strategies for better data visualization
February 24, 2025
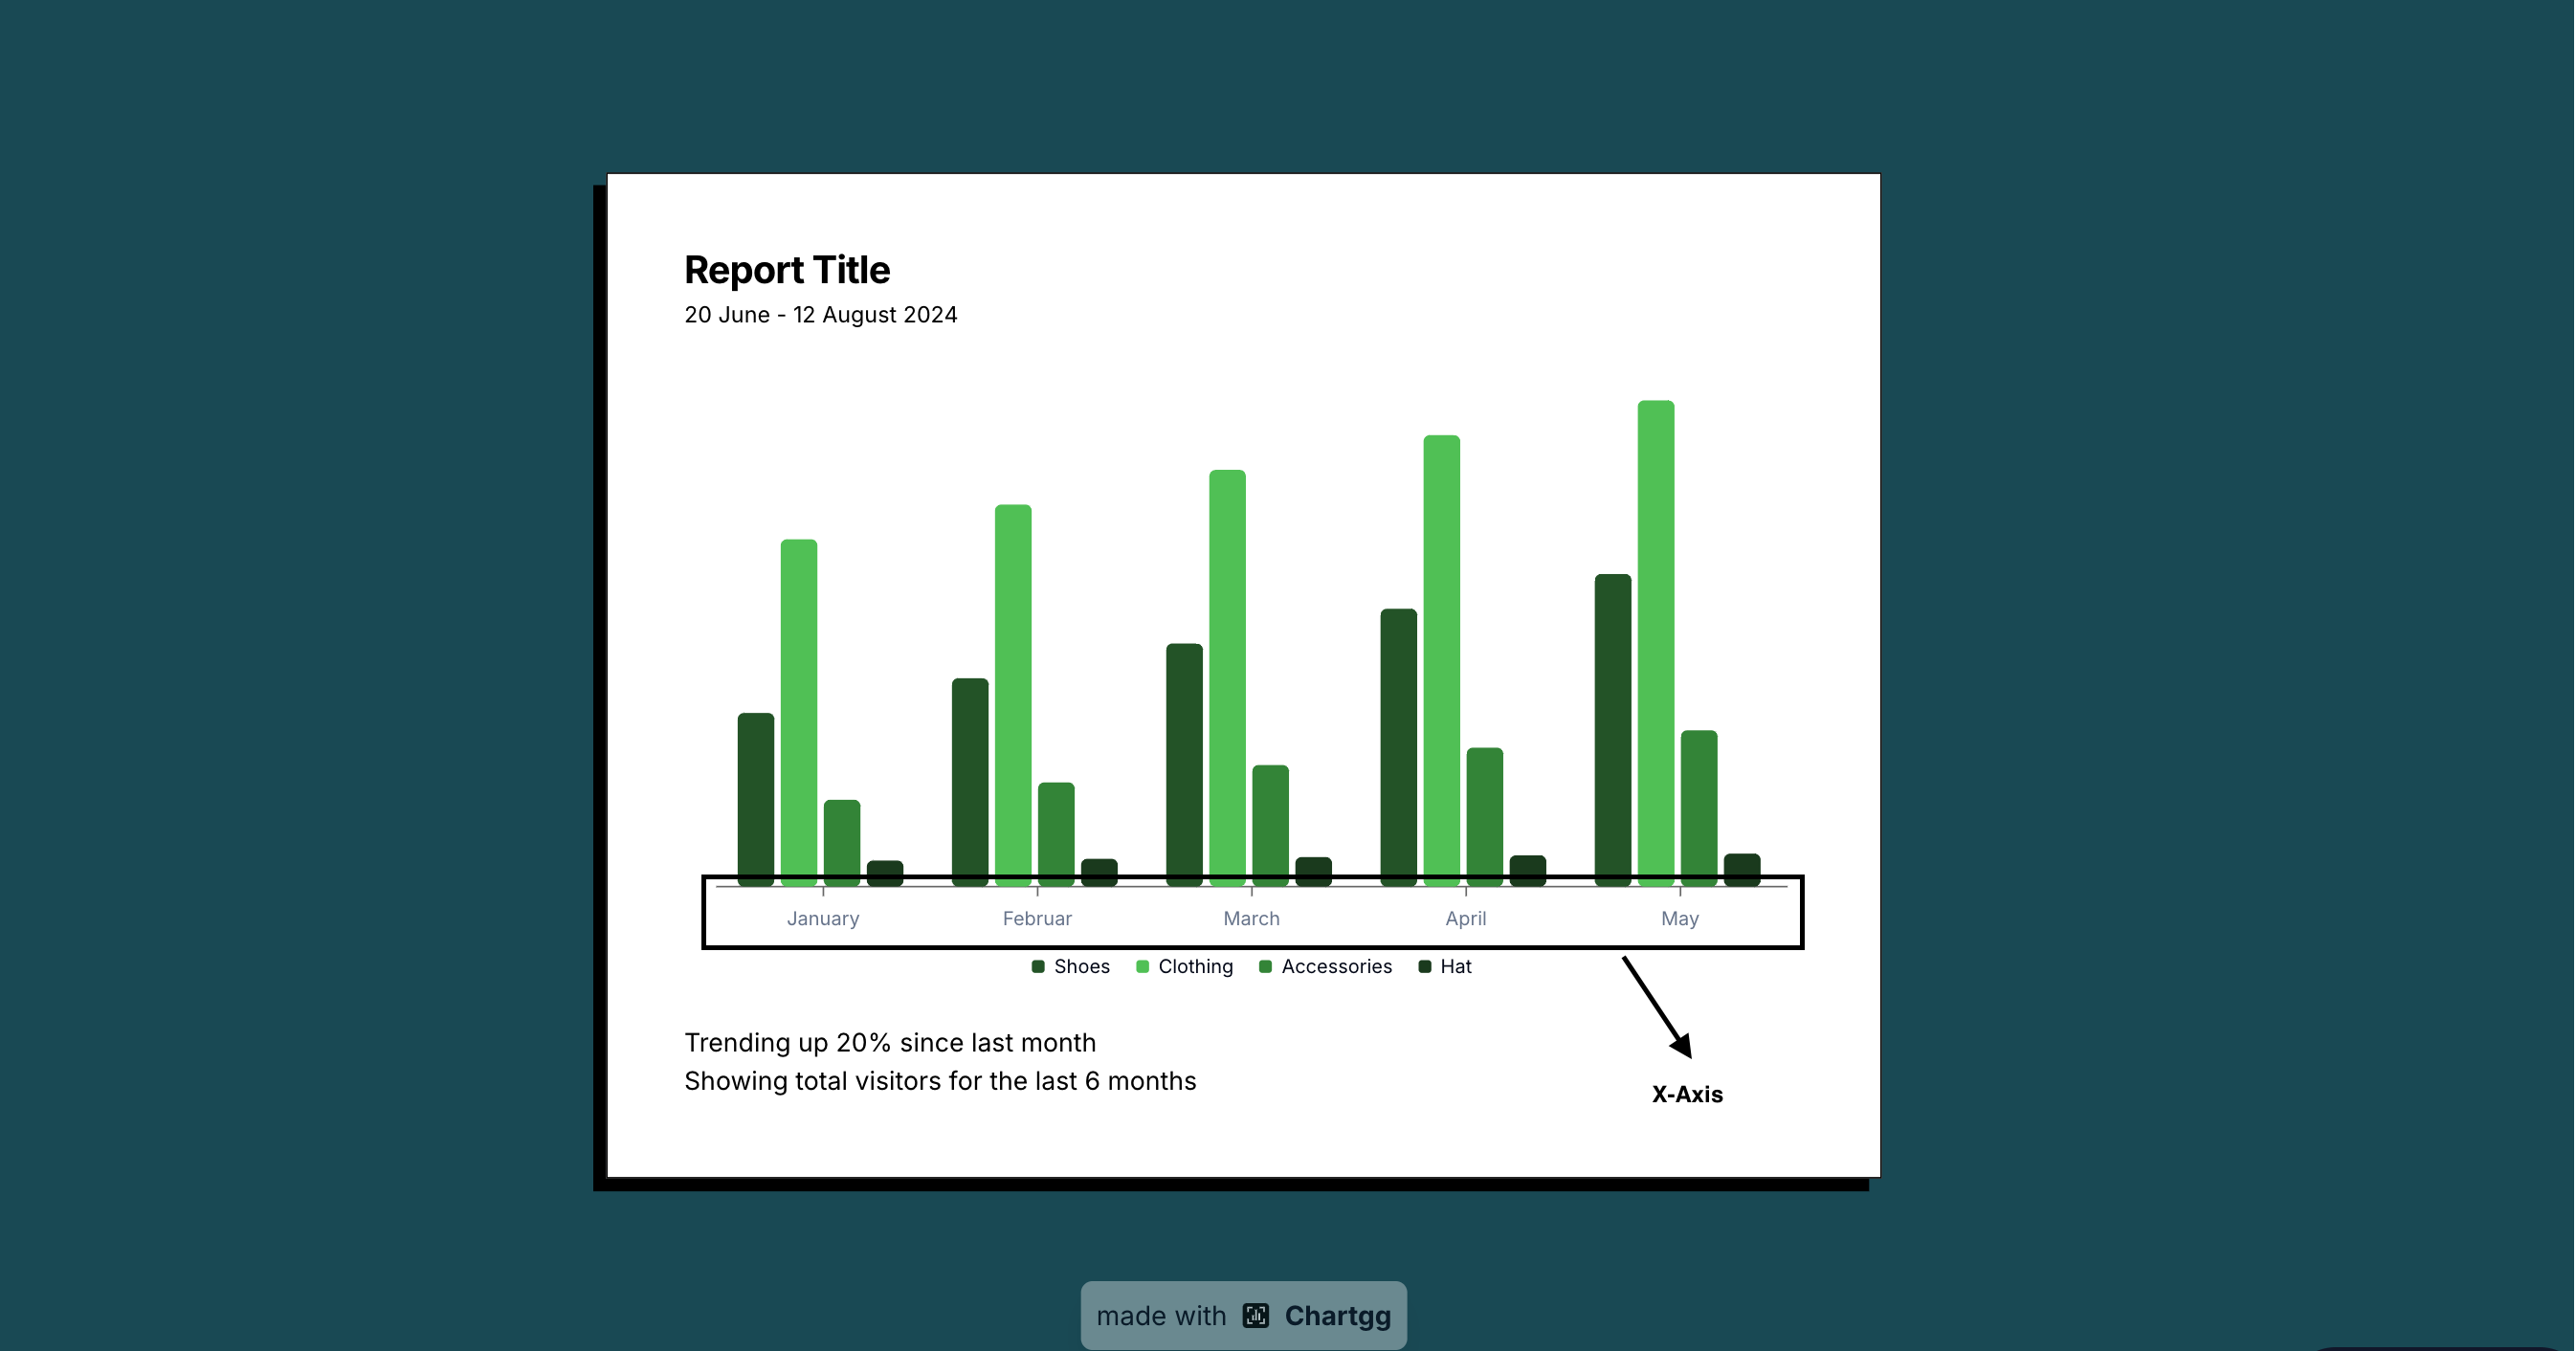
Learn everything you need to know about the x-axis in charts, its importance, and how to use it effectively in data visualization.
February 24, 2025
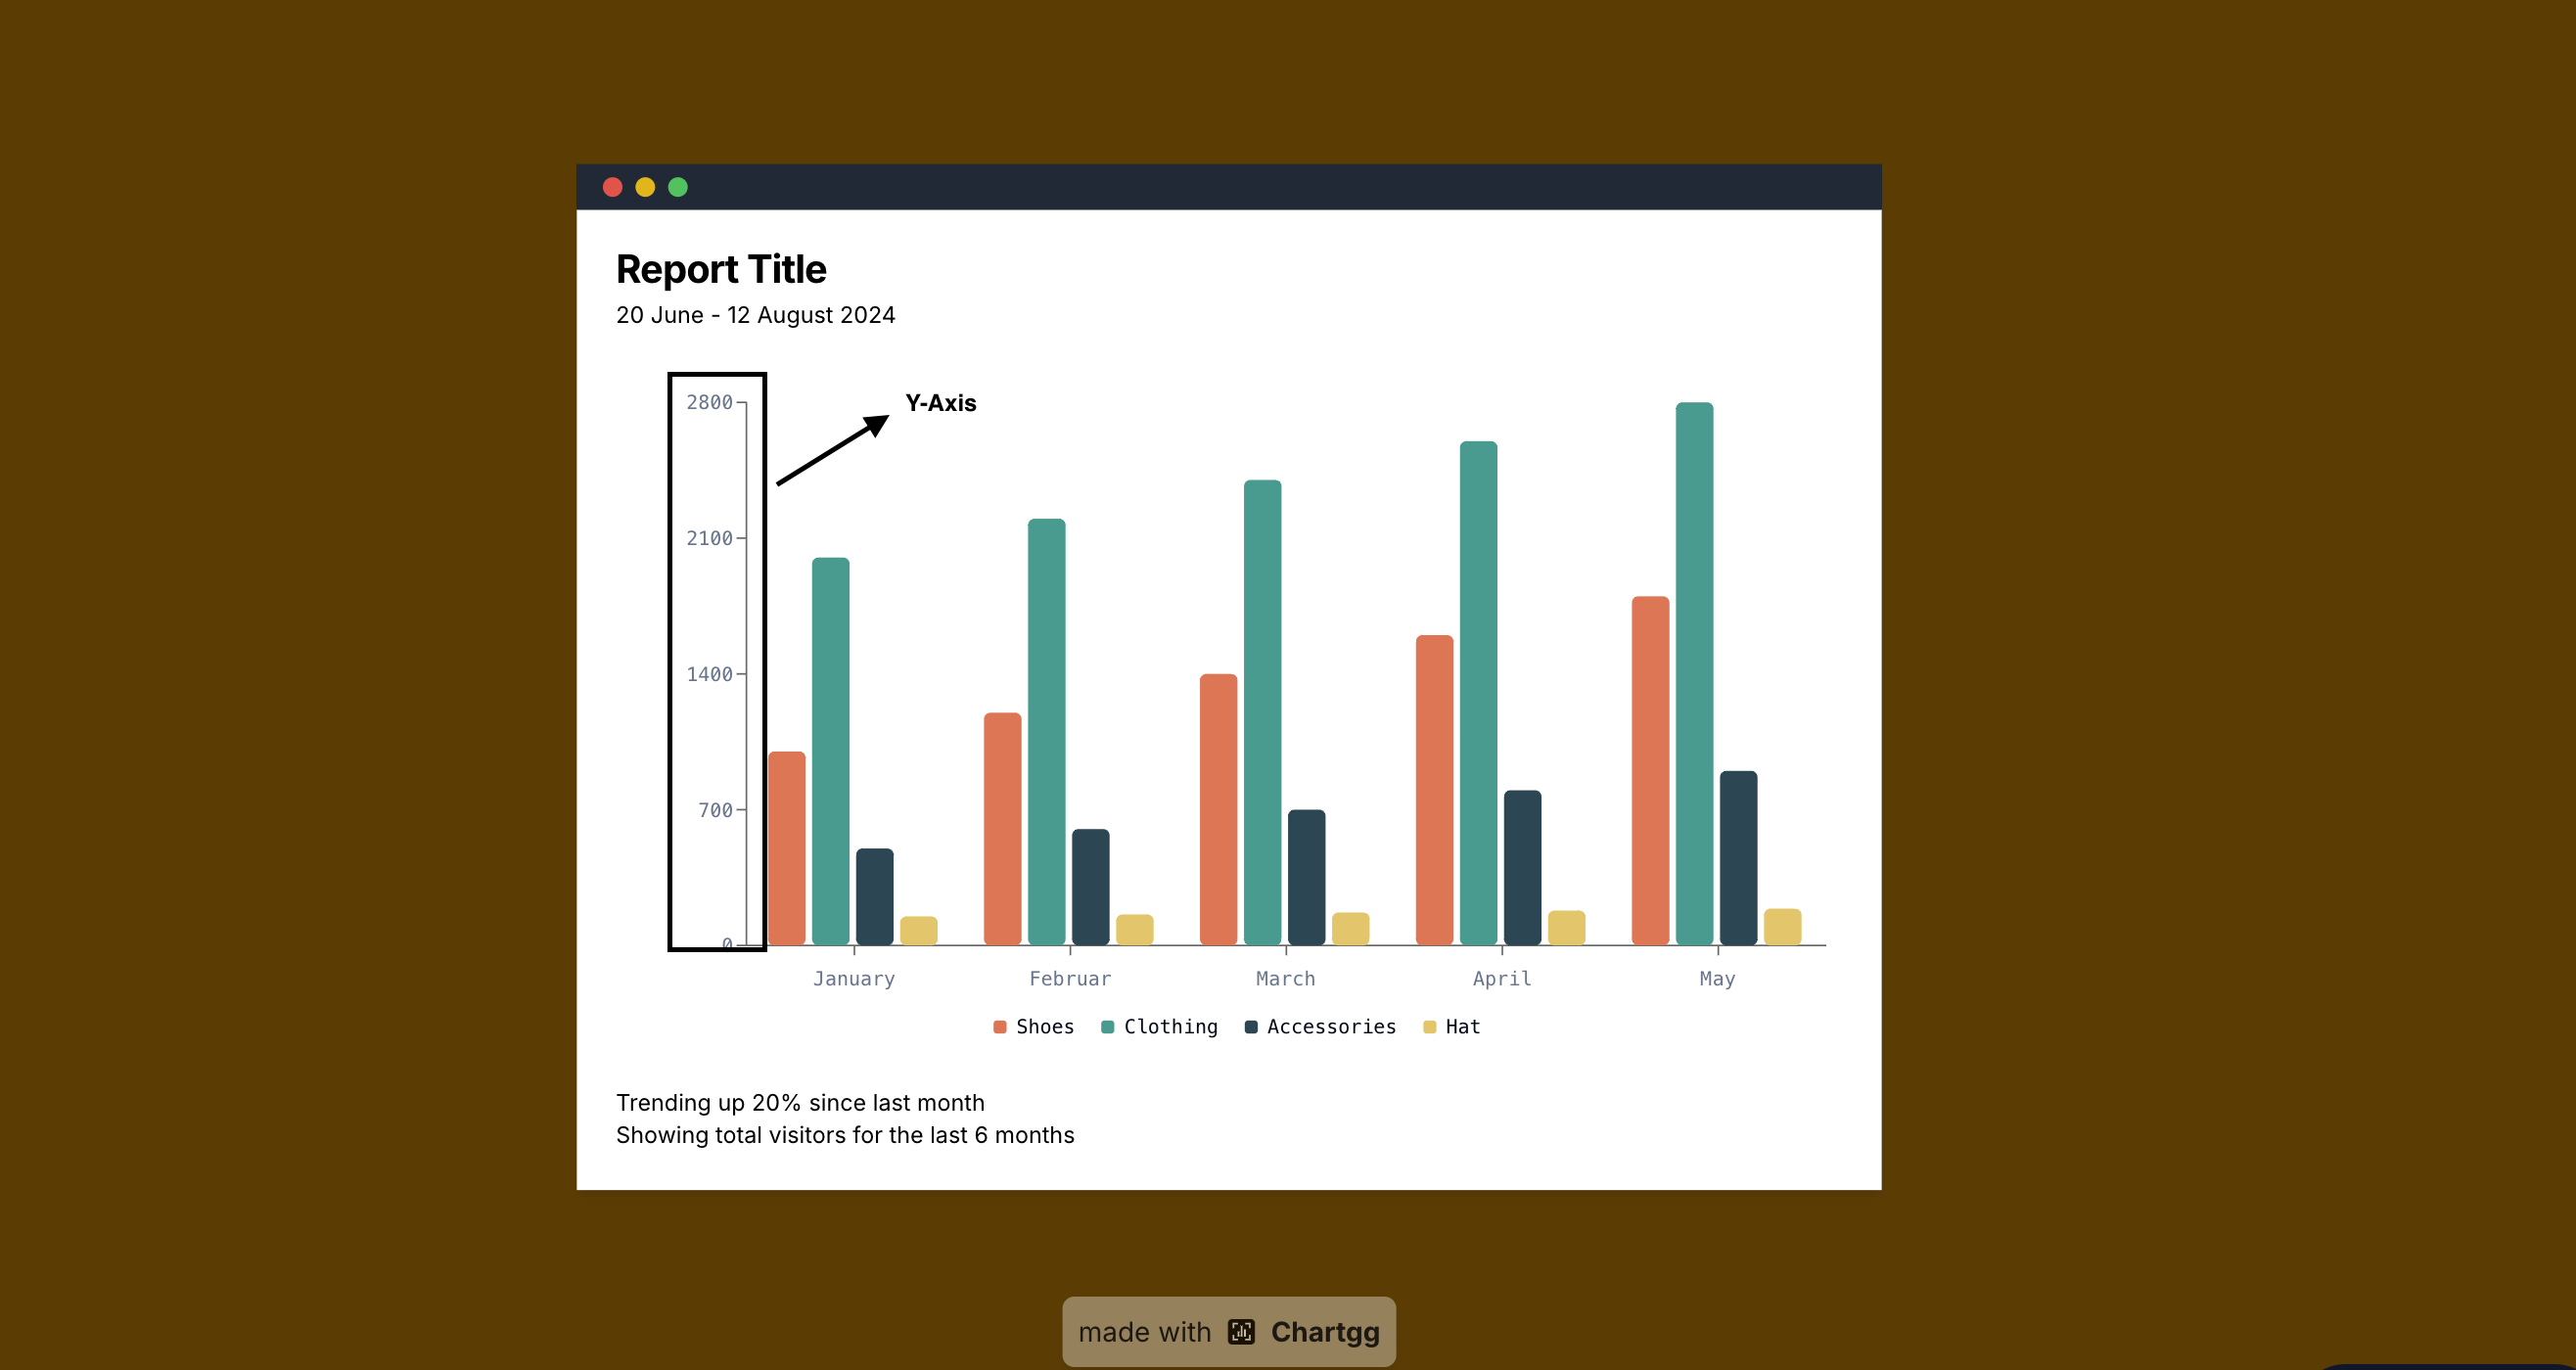
Learn everything you need to know about the y-axis in charts, its importance, and how to use it effectively in data visualization.

February 20, 2025
Master the art of creating effective bar charts for data visualization

February 19, 2025
Explore the latest trends shaping the future of data visualization in 2025, from interactive experiences to AI-driven insights and ethical considerations.
February 15, 2025
Explore why chart legends are crucial in data visualization, enhancing clarity, consistency, and accessibility.
February 14, 2024
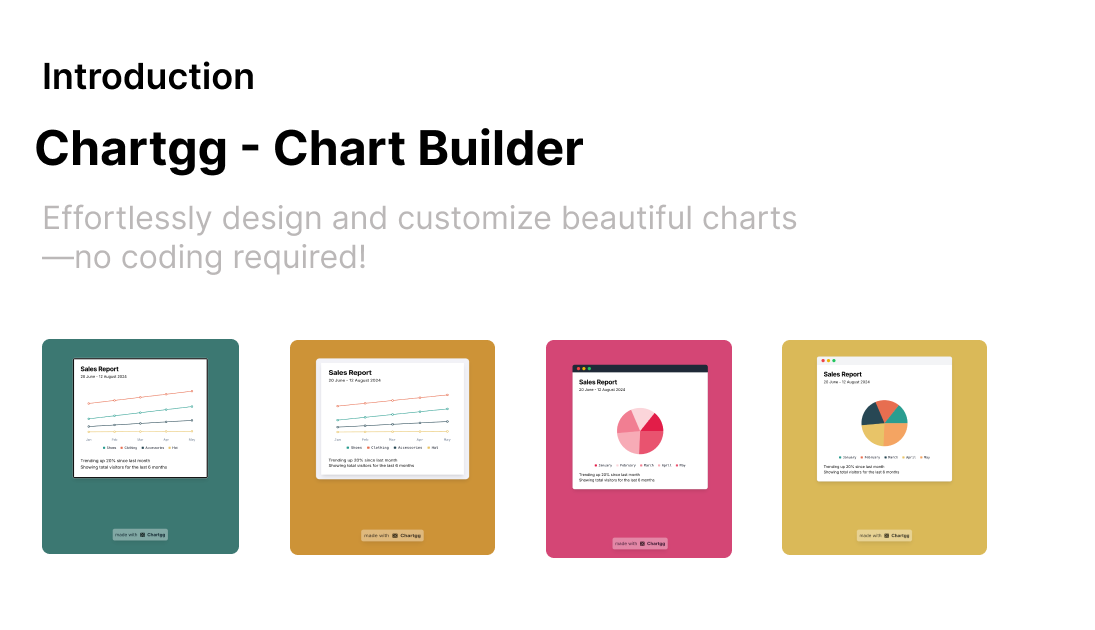
Learn about ChartGG, a powerful and intuitive data visualization tool that helps you create beautiful charts with ease.
February 14, 2024
Learn the key principles of styling charts to create clear, impactful, and professional data visualizations that effectively communicate your insights.