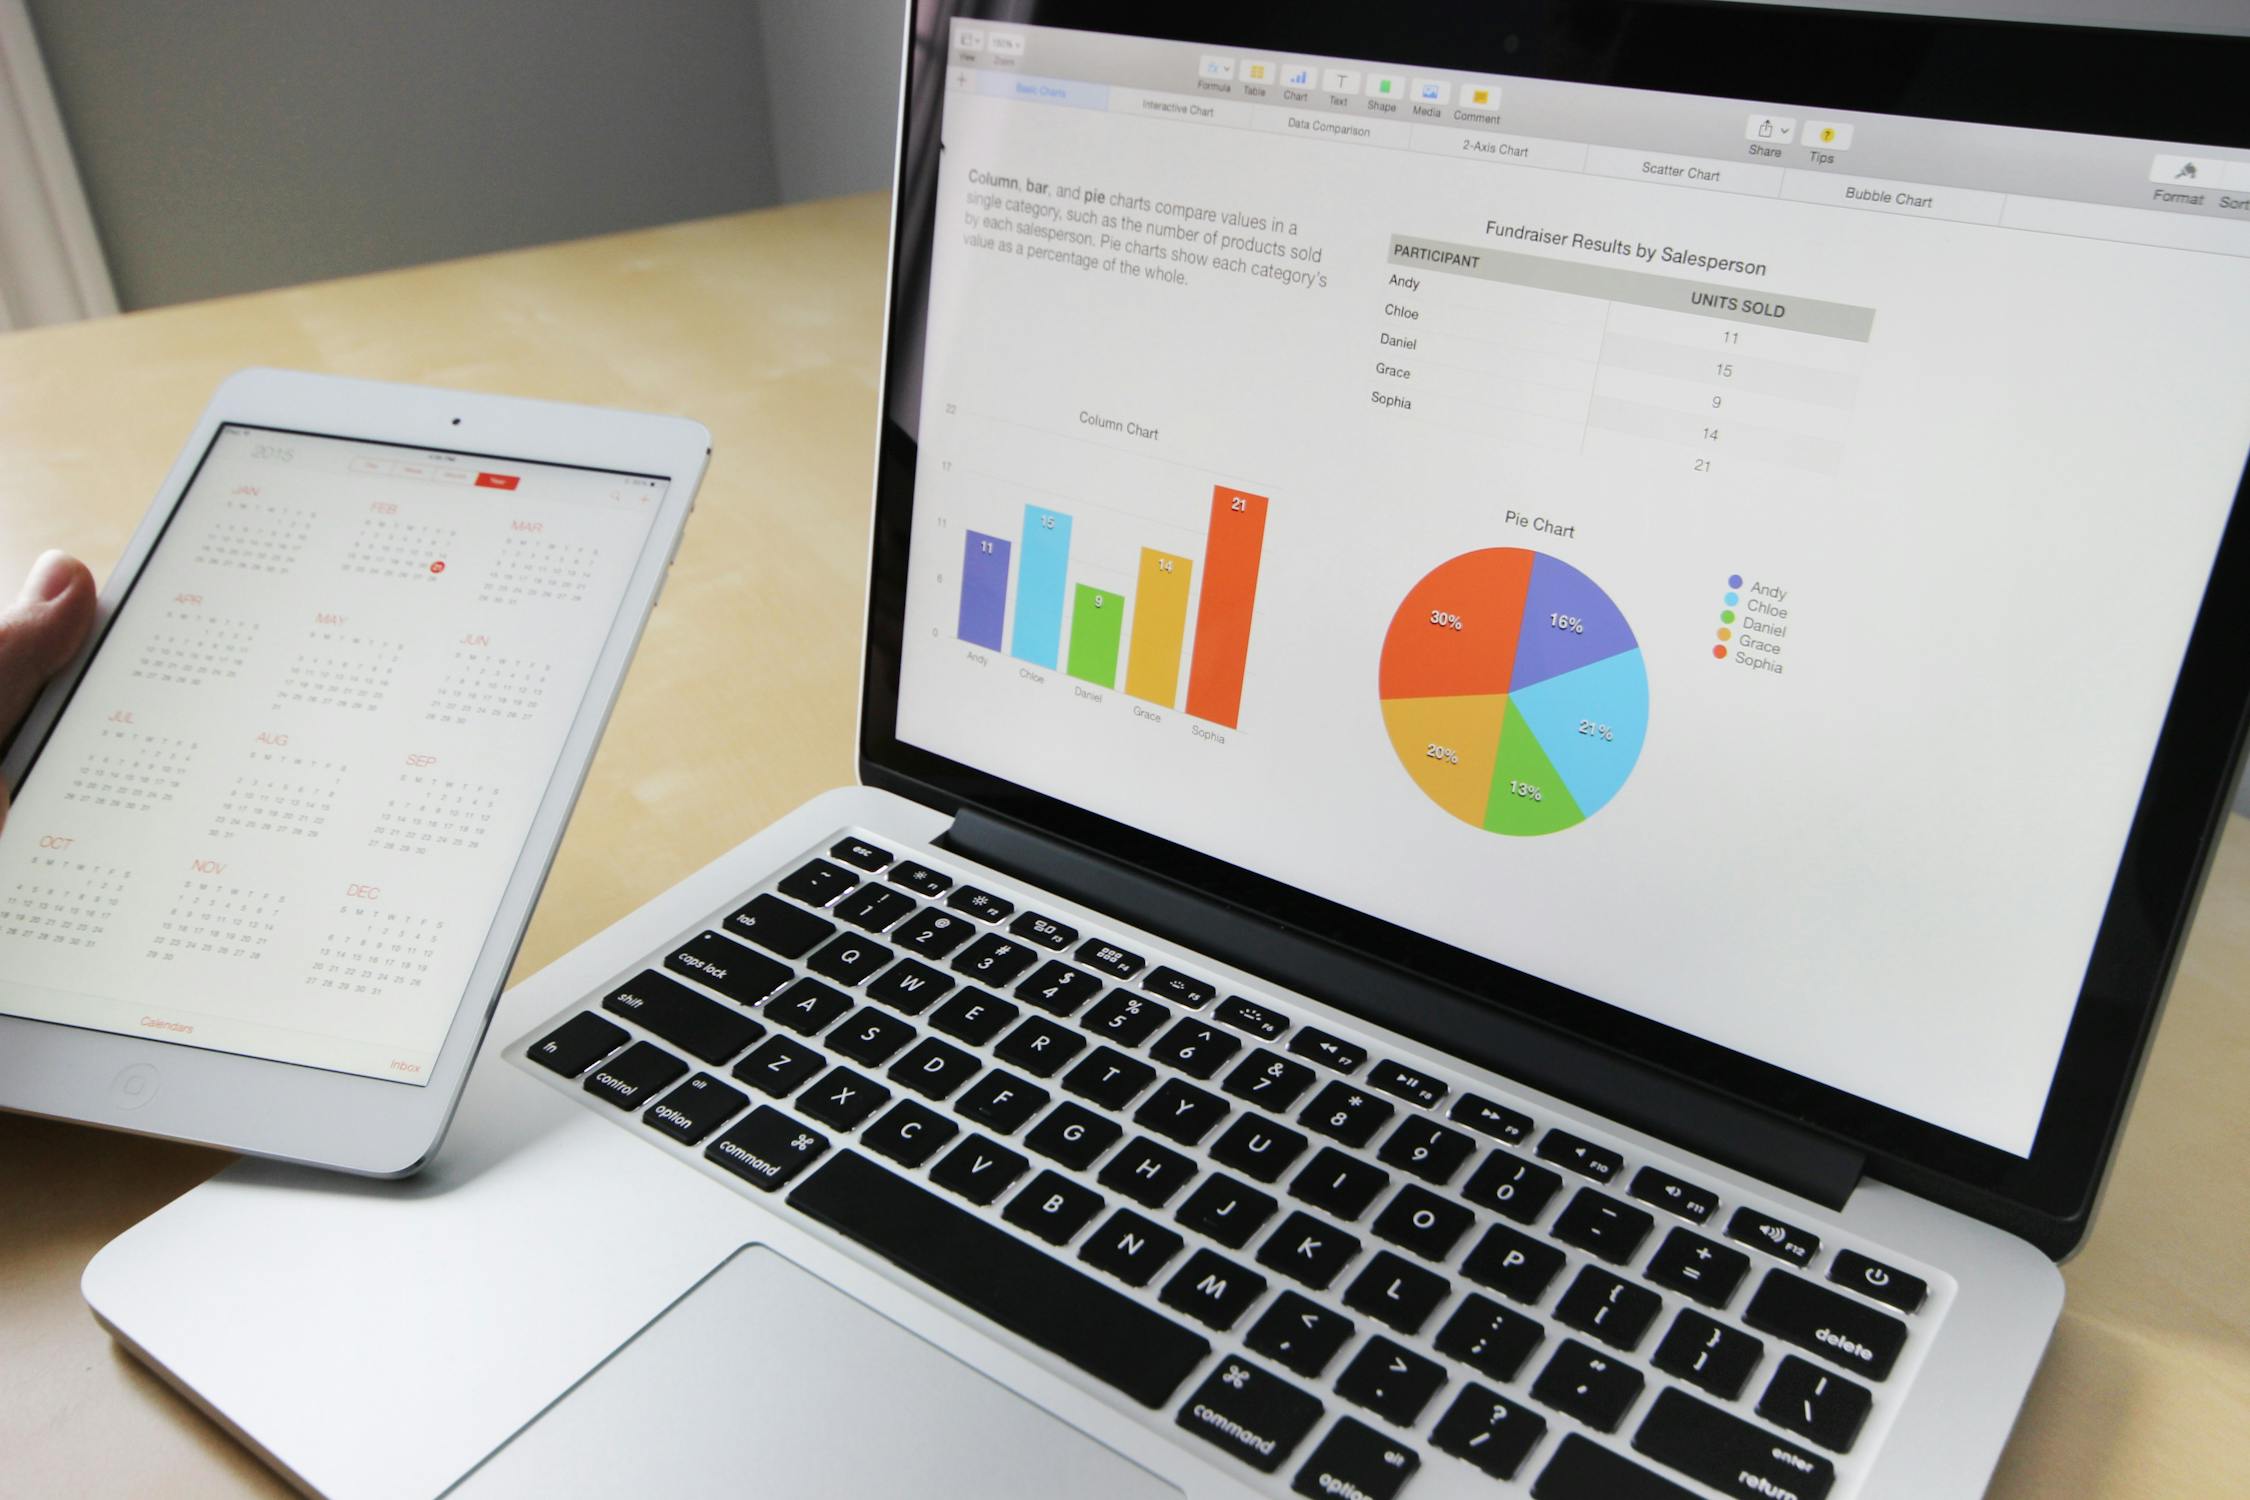
The Complete Guide to Pie Charts
The Complete Guide to Pie Charts
Pie charts are powerful visualization tools that excel at showing part-to-whole relationships in your data. When used correctly, they provide an intuitive way to understand how different components contribute to a total. This comprehensive guide will help you master the art of creating effective pie charts and understand when to use them.
Understanding Pie Charts
What is a Pie Chart?
A pie chart is a circular statistical graphic divided into slices, where each slice represents a proportion of the whole. The arc length and area of each slice are proportional to the quantity it represents. The entire circle (pie) represents 100% of the data.
When to Use Pie Charts
Pie charts are most effective when:
- Showing proportional parts of a whole
- Displaying percentage distributions
- Comparing relative sizes of categories
- Working with a small number of categories (ideally 5-7)
- All values are positive and sum to a meaningful total
Best Practices for Pie Charts
1. Limit the Number of Slices
Too many slices can make a pie chart difficult to read and interpret. Stick to these guidelines:
- Use 5-7 slices for optimal readability
- Combine smaller categories into an "Other" category
- Consider using a different chart type if you have more than 8 categories
2. Order Slices Meaningfully
Arrange slices in a way that enhances understanding:
- Order from largest to smallest
- Start at 12 o'clock position
- Place the largest slice at 12 o'clock for emphasis
- Group related categories together when appropriate
3. Use Clear Labels and Colors
Make your pie chart easily readable:
- Use contrasting colors for adjacent slices
- Ensure labels are clear and legible
- Include percentage values in labels
- Use a consistent color scheme for related data
- Consider using direct labels instead of a legend
Common Variations
Donut Charts
Donut charts are a popular variation of pie charts with a hollow center. They offer several advantages:
- More space for central statistics or labels
- Often perceived as more modern and elegant
- Can be easier to compare slice sizes
- Work well in dashboard designs
Exploded Pie Charts
Exploded pie charts separate one or more slices from the main pie:
- Use to emphasize specific segments
- Limit to one or two slices to maintain clarity
- Avoid over-exploding as it can distort perception
When Not to Use Pie Charts
While pie charts are valuable tools, they're not suitable for every situation:
- Comparing precise values
- Showing changes over time
- Displaying negative values
- Comparing multiple datasets
- Working with many categories
Alternative Chart Types
Consider these alternatives when pie charts aren't optimal:
- Bar charts for comparing quantities
- Column charts for time-series data
- Treemaps for hierarchical data
- Stacked bar charts for multiple categories
- Line charts for trends over time
Tips for Creating Effective Pie Charts
-
Keep it Simple
- Avoid 3D effects
- Minimize decorative elements
- Use clear, readable fonts
- Include only necessary information
-
Ensure Accuracy
- Verify that all values sum to 100%
- Double-check calculations
- Use precise measurements for slice angles
-
Consider Your Audience
- Adapt complexity to viewer expertise
- Use familiar color schemes
- Include explanatory notes when needed
- Make labels understandable
Conclusion
Pie charts, when used appropriately, are powerful tools for visualizing proportional data. By following these best practices and guidelines, you can create effective pie charts that clearly communicate your data's story. Remember to consider your audience and data type when choosing between pie charts and alternative visualization methods.
Remember that the key to successful data visualization is not just creating beautiful charts, but effectively communicating your message to your audience. Use pie charts thoughtfully and they will become a valuable addition to your data visualization toolkit.
Ready to Create Your Own Pie Charts?
Start creating professional pie charts today and transform your data into clear, insightful part-to-whole visualizations.
Related Articles
The Evolution of Data Visualization: Trends to Watch in 2025
Explore the latest trends shaping the future of data visualization in 2025, from interactive experiences to AI-driven insights and ethical considerations.
The Importance of Chart Legends
Explore why chart legends are crucial in data visualization, enhancing clarity, consistency, and accessibility.
Introducing ChartGG: The Next Generation Data Visualization Tool
Learn about ChartGG, a powerful and intuitive data visualization tool that helps you create beautiful charts with ease.
